MCPInstall
Excel Bridge logo

Excel Bridge

by bigcoder84 7 stars bigcoder84/mcp-excel-server

Bridges AI with Excel files, enabling reading from and writing to spreadsheets through standardized operations for data analysis, reporting, and document generation workflows.

READMEmaster

mcp-excel-server

项目概述

mcp-excel-server 是一个基于 Spring AI MCP 框架开发的项目,其主要功能是借助 MCP 协议,为大语言模型(LLM)提供对本地 Excel 文件进行读取和写入操作的能力。通过本项目,AI 能够像人类一样调用本地工具,突破静态知识库的限制,实现动态交互。

功能特性

  • Excel 文件读取:能够读取本地 Excel 文件(支持 .xlsx 和 .xls 格式),并将内容以 JSON 格式返回。

  • Excel 文件写入:可以把 JSON 数据写入到指定的本地 Excel 文件中。 与 LLM 集成:可与支持 MCP 协议的 LLM 客户端集成,如 Claude、Cursor 和 Cherry Studio 等。

环境要求

Java 17 及以上

安装与配置

第一步:执行下列命令打包:

mvn clean package -Dmaven.test.skip=true

第二步:配置MCP Server

{
  "mcpServers": {
    "AUM5itYnoMcxPiU2vFa3Z": {
      "name": "Excel操作",
      "type": "stdio",
      "description": "",
      "isActive": true,
      "command": "java",
      "args": [
        "-Dspring.ai.mcp.server.stdio=true",
        "-Dspring.main.web-application-type=none",
        "-Dfile.encoding=UTF-8",
        "-jar",
        "{your_path}/mcp-excel-server-0.0.1-SNAPSHOT.jar"
      ]
    }
  }
}

功能演示
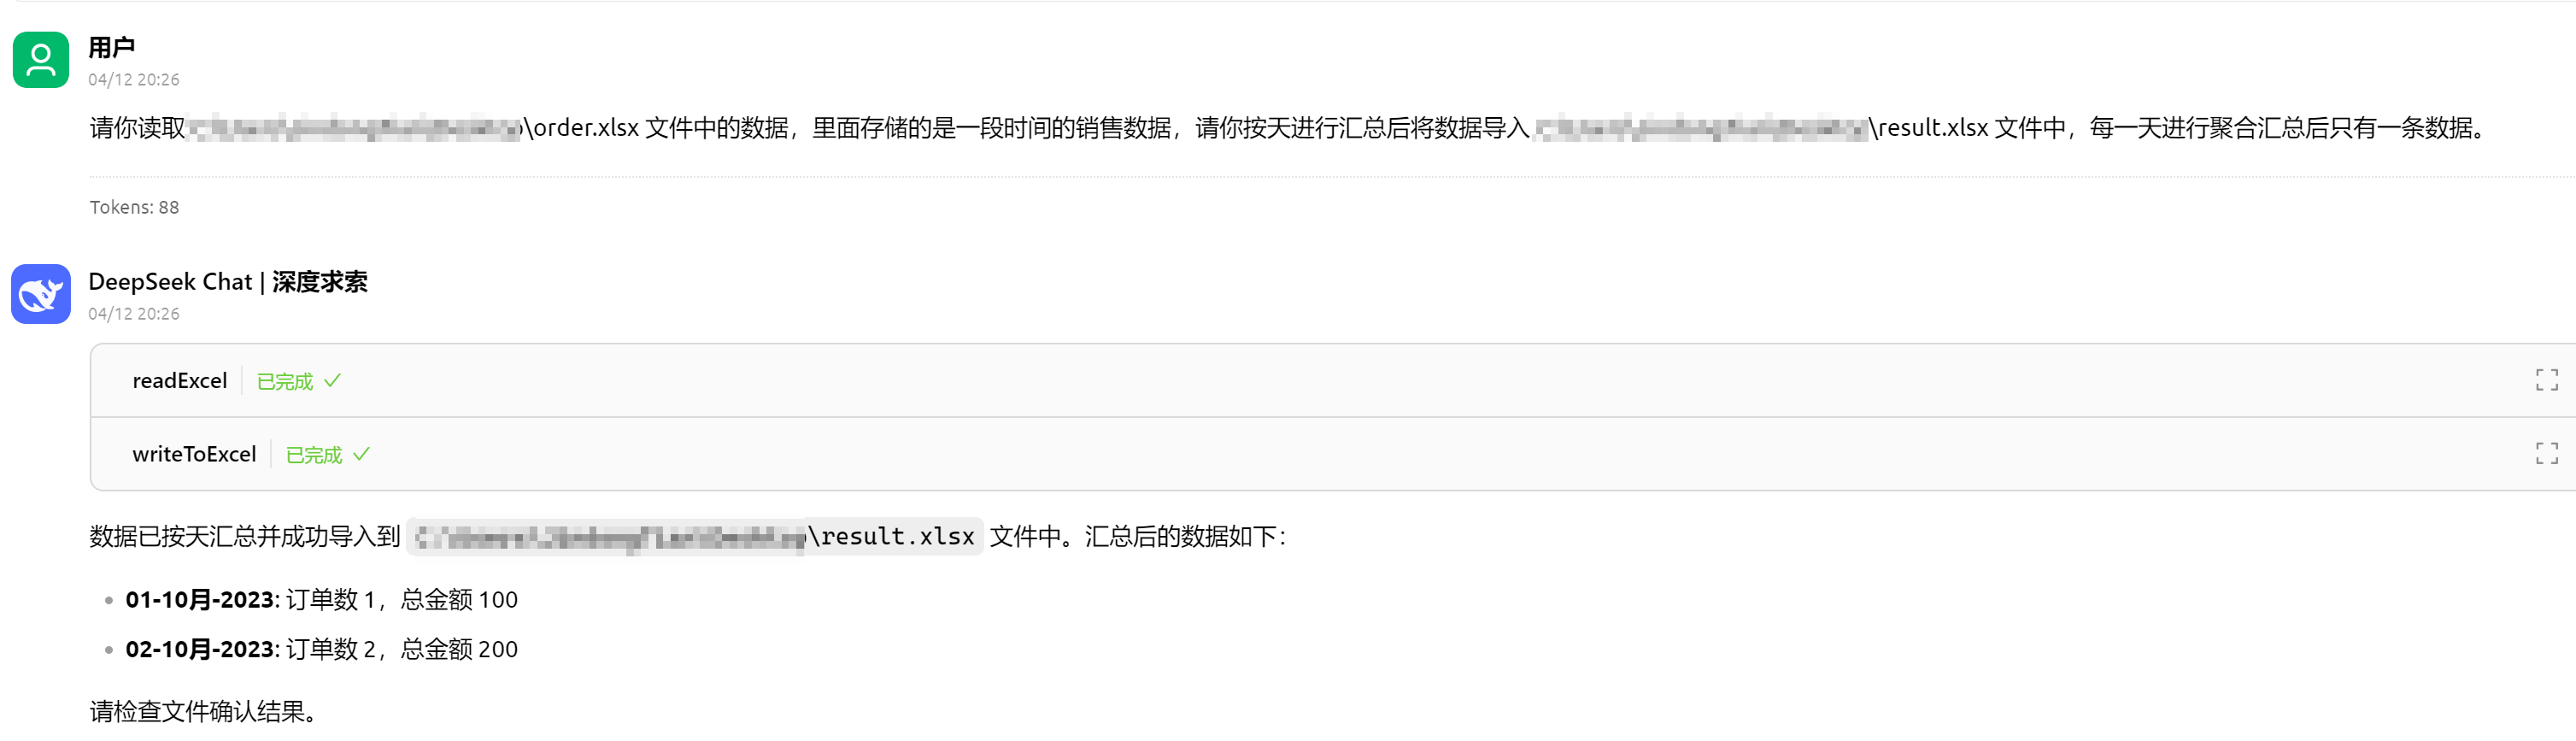
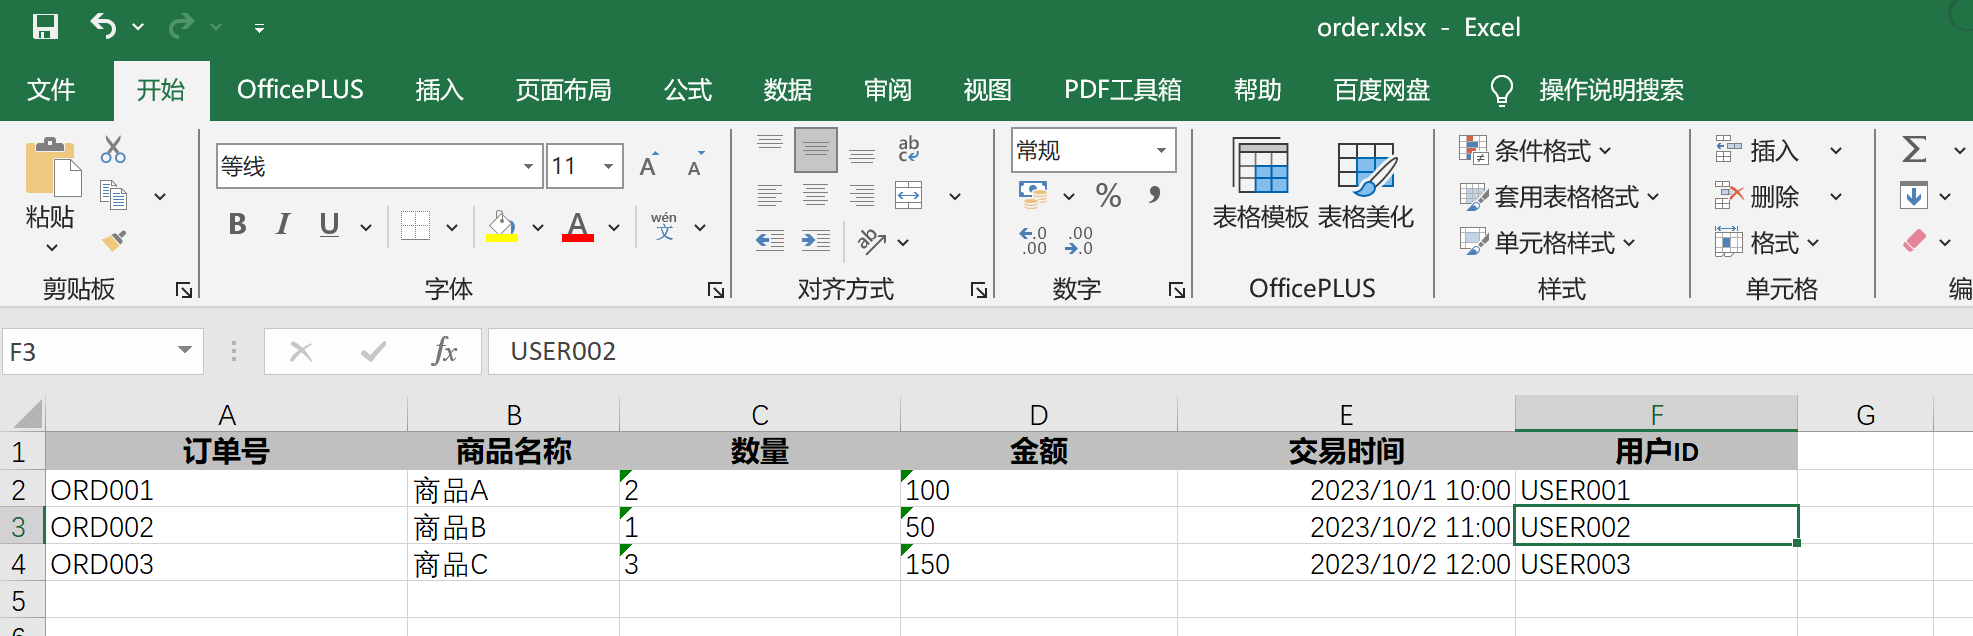
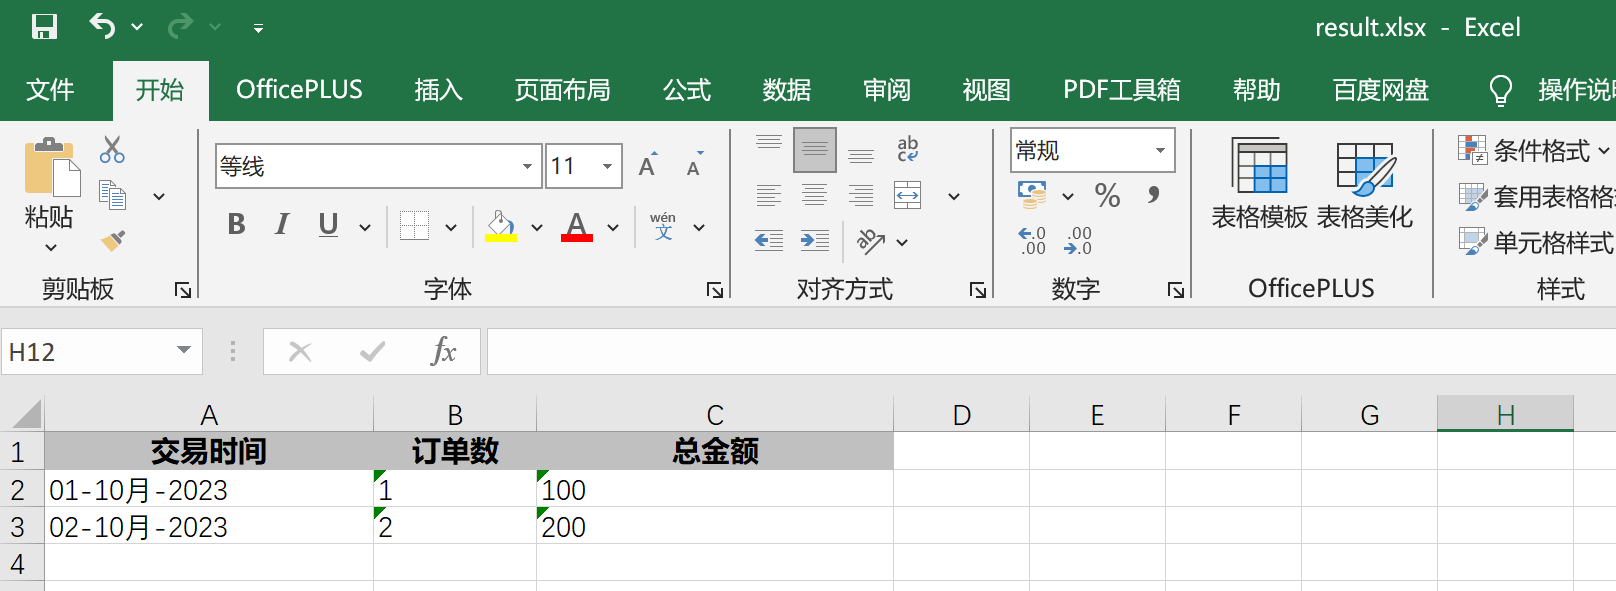
order.xlsx: 生成的结果:
More Data Analysis & Visualization MCP servers

Similar servers from the same category.

CoinStats

coinstatshq

Provides real-time cryptocurrency market data, portfolio tracking, and news through direct access to the CoinStats API for retrieving coin information, market trends, wallet balances, and exchange integrations.

DataTrack+1

Vizro

mckinsey

Enables creation and validation of data visualization dashboards through natural language by generating chart code, validating configurations, and producing interactive Vizro visualizations with PyCafe preview links.

Data Analysis & Visualization

Provides a bridge between AI agents and Atlan data catalog services for searching, retrieving, traversing lineage, and updating asset metadata through the pyatlan SDK

search

Integrates tools powered by the Cloudflare DNS Analytics API to provide insights on DNS analytics and optimization.

Data Analysis & Visualization